US Money Search Trends: October 2026 Query Sample
Explore 1398 selected finance search terms using US Google Trends scores. Collected 2026-09-07 to 2026-10-01; ranked tables, methods and CSV/JSON downloads.

- 01bitcoin price has the highest score among the 1343 terms not flagged by our brand filter: 2,251.2, with emergency fund = 100. This ranks our selected terms, not every US finance search.
- 02Tool wording: 1 of the top 20 unflagged terms contain calculator or estimator. This describes query wording; it does not establish a searcher's motive.
- 03Largest recent-mean premium in the screened sample: jobs report july 2026, +241% versus its full-series mean. This is not month-over-month growth.
- 04Collection dates: 24 terms on 2026-09-07; 8 terms on 2026-09-14; 60 terms on 2026-09-15; 185 terms on 2026-09-16; 1 terms on 2026-09-17; 21 terms on 2026-09-18; 171 terms on 2026-09-19; 146 terms on 2026-09-20; 29 terms on 2026-09-21; 35 terms on 2026-09-22; 2 terms on 2026-09-23; 191 terms on 2026-09-24; 108 terms on 2026-09-25; 28 terms on 2026-09-26; 106 terms on 2026-09-27; 29 terms on 2026-09-28; 129 terms on 2026-09-29; 113 terms on 2026-09-30; 12 terms on 2026-10-01. Different retrieval dates mean the requested trailing-year windows are not identical.
Highest-scoring terms in this sample
The top 15 terms not flagged by our brand filter. Scores compare each term's mean Google Trends interest with the anchor "emergency fund" = 100. A score of 200 is approximately twice the anchor's mean relative interest, not 200 searches.
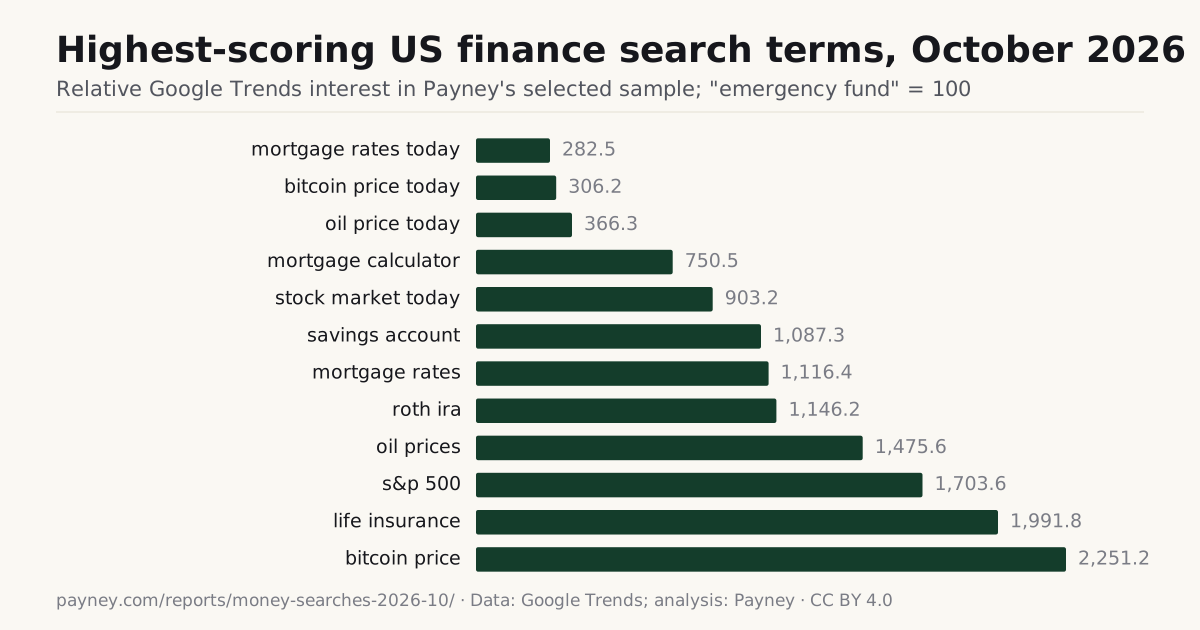
On smaller screens, scroll the tables sideways to see every column.
| Term | Topic | Score | Recent difference |
|---|---|---|---|
| bitcoin price | Unclassified | 2,251.2 | -37% |
| life insurance | Insurance | 1,991.8 | -4% |
| s&p 500 | Markets | 1,703.6 | -19% |
| oil prices | Markets | 1,475.6 | -2% |
| roth ira | Investing & retirement | 1,146.2 | -10% |
| mortgage rates | Mortgages & housing | 1,116.4 | -20% |
| savings account | Banking | 1,087.3 | -5% |
| stock market today | Markets | 903.2 | +6% |
| mortgage calculator | calculators | 750.5 | -14% |
| oil price today | Markets | 366.3 | -1% |
| bitcoin price today | Unclassified | 306.2 | -38% |
| mortgage rates today | Mortgages & housing | 282.5 | -26% |
| budget car rental | Saving & budgeting | 269.2 | +3% |
| high yield savings account | Banking | 267.9 | +4% |
| inflation rate | Unclassified | 267.6 | -31% |
What the sample covers
We selected finance terms for Payney's editorial planning. The table counts the 1343 unflagged terms in that selection. Topic sizes depend on the seed list and expansions; they are not shares of US searches. Related terms can cover overlapping searches, so we do not add their scores into a market-share chart.
| Topic | Selected terms |
|---|---|
| Unclassified | 1217 |
| Insurance | 12 |
| Markets | 12 |
| Investing & retirement | 12 |
| Mortgages & housing | 12 |
| Banking | 12 |
| calculators | 12 |
| Saving & budgeting | 12 |
| Economy & rates | 12 |
| Tax & regulation | 12 |
| Crypto | 11 |
| Fintech & payments | 7 |
Terms with a higher recent mean
Recent difference = (cached momentum ratio − 1) × 100. For example, +15% means the last 12 returned observations averaged 1.15 times the full-series mean. It is not a comparison with the previous month. This screen includes unflagged terms with score ≥ 5 and ratio ≥ 1.15, ordered by ratio.
| Term | Topic | Score | Recent difference |
|---|---|---|---|
| jobs report july 2026 | Unclassified | 14.4 | +241% |
| jobs report july | Economy & rates | 16.5 | +210% |
| jobs report august 2026 | Unclassified | 6.9 | +199% |
| clarity act vote | Unclassified | 11.2 | +170% |
| fed rate hike | Unclassified | 14.1 | +152% |
| clarity act senate | Unclassified | 17.5 | +114% |
| clarity act news | Unclassified | 24.2 | +112% |
| ethereum etf flows | Unclassified | 5.2 | +112% |
| clarity act | Unclassified | 131.9 | +99% |
| clarity act update | Unclassified | 7.6 | +90% |
Terms with a lower recent mean
This screen includes unflagged terms with score ≥ 5 and ratio ≤ 0.60, ordered by ratio. A negative value is a lower recent mean; the saved aggregates cannot show when a peak occurred or explain its cause.
| Term | Topic | Score | Recent difference |
|---|---|---|---|
| what is tax brackets for 2025 | Tax & regulation | 14.7 | -91% |
| tariffs definition | Economy & rates | 19.0 | -86% |
| cost dollar averaging | Unclassified | 15.1 | -85% |
| how to forecast bitcoin price | Unclassified | 5.0 | -85% |
| tariffs supreme court | Unclassified | 62.5 | -84% |
| jobs report 2024 vs 2025 | Unclassified | 6.6 | -83% |
| how to price cryptocurrency | Unclassified | 14.5 | -82% |
| what is us jobs report | Unclassified | 7.0 | -81% |
| inflation rate vs cpi | Unclassified | 5.3 | -81% |
| jobs report april 2026 | Unclassified | 13.4 | -79% |
Terms containing calculator or estimator
The highest-scoring 8 unflagged terms matching those words. Their presence suggests topics to investigate for practical answers; it does not measure a preference for tools over explanations.
| Term | Topic | Score | Recent difference |
|---|---|---|---|
| mortgage calculator | calculators | 750.5 | -14% |
| inflation calculator | calculators | 154.9 | -18% |
| savings calculator | calculators | 88.9 | -12% |
| mortgage payment calculator | Mortgages & housing | 88.2 | -6% |
| 401k calculator | calculators | 78.0 | -14% |
| mortgage rates calculator | Mortgages & housing | 71.4 | -27% |
| refinance calculator | calculators | 56.7 | -16% |
| roth ira calculator | calculators | 46.3 | -8% |
Brand-filtered terms
Our name filter flagged 55 terms, excluded from the rankings above. The filter is heuristic and may miss brands or flag ambiguous wording. The five highest-scoring flagged terms are shown here; all flags are retained in the downloads.
| Term | Topic | Score | Recent difference |
|---|---|---|---|
| apple card | Unclassified | 1,221.1 | -6% |
| 401k fidelity | Unclassified | 172.7 | +9% |
| apple card support | Unclassified | 47.9 | -36% |
| apple card balance | Unclassified | 44.8 | -5% |
| apple card payment | Unclassified | 42.7 | -7% |
Method and limitations
Collection dates (UTC): 24 terms on 2026-09-07; 8 terms on 2026-09-14; 60 terms on 2026-09-15; 185 terms on 2026-09-16; 1 terms on 2026-09-17; 21 terms on 2026-09-18; 171 terms on 2026-09-19; 146 terms on 2026-09-20; 29 terms on 2026-09-21; 35 terms on 2026-09-22; 2 terms on 2026-09-23; 191 terms on 2026-09-24; 108 terms on 2026-09-25; 28 terms on 2026-09-26; 106 terms on 2026-09-27; 29 terms on 2026-09-28; 129 terms on 2026-09-29; 113 terms on 2026-09-30; 12 terms on 2026-10-01. The edition contains 1398 positive-scoring terms. Excluded cache entries: zero score: 918. New editions accept valid scores collected within 31 days of the snapshot; zero scores are omitted, not interpreted as zero demand.
Payney expands editorial finance seeds using Google Autocomplete and scores terms in batches of four plus the anchor. The scanner requests US interest over time with a trailing 12-month window. Score = 100 × mean(term) / mean(anchor), rounded to one decimal. Momentum = mean(last 12 returned observations) / mean(all returned observations), rounded to two decimals. Percentages above are derived from that rounded ratio.
The saved cache contains aggregate scores and retrieval timestamps, not the underlying time series. Its exact observation dates, sampling frequency and partial-period flags were not retained, and the scanner did not explicitly exclude partial observations. We cannot reconstruct those details or verify seasonal explanations from this export. Separately sampled batches, rounding and differing collection dates limit cross-term precision.
Google Trends provides sampled, normalized interest, not search counts or a poll. Low-volume terms can show zero and noise can affect small signals. Autocomplete is filtered and is not a comprehensive list of popular terms. See Google's data explanation.
These are Trends search terms, not mutually exclusive exact queries. Unquoted multiword terms can include additional words and different word order; related terms can overlap. See Google's search-term rules. This selected sample does not measure total US finance demand, unique people, keyword competition or ranking potential. Changing samples and trailing windows also prevent a simple month-to-month growth comparison.
Download and cite
Download scored terms (CSV) or download the frozen snapshot and methodology (JSON). Both contain 1398 rows, including collection timestamp, anchor and brand/tool flags. These are Payney's aggregate calculations, not Google's original time series. Each edition keeps its saved inputs when the report is rebuilt.
Payney's original analysis is available under CC BY 4.0. Source data is from Google Trends and remains subject to Google's terms; include Google attribution when reusing it, as explained in Google's citation guidance. Suggested citation: Payney, "US Money Search Trends: October 2026 Query Sample", collected 2026-09-07 to 2026-10-01. Data source: Google Trends; analysis: Payney. https://payney.com/reports/money-searches-2026-10/.
- Google Trends · Google
- Google Trends data and normalization · Google
Data collected 2026-09-07 to 2026-10-01 (UTC). US request setting; trailing 12 months requested per collection. Edition: October 2026.